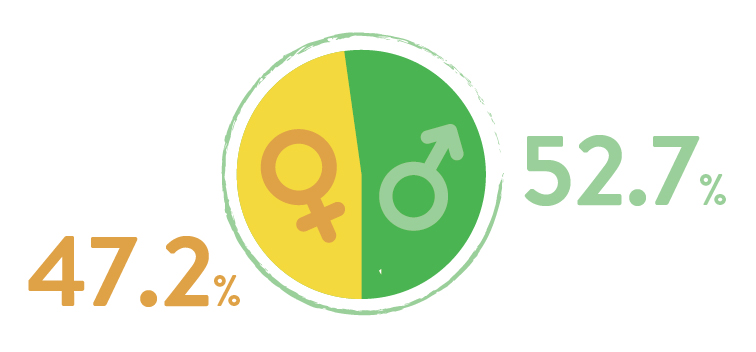
What is the Size of Indigenous People Workforce?
There are 140,870 males, accounting for 52.7%, and 126,297 females, accounting for 47.2%.
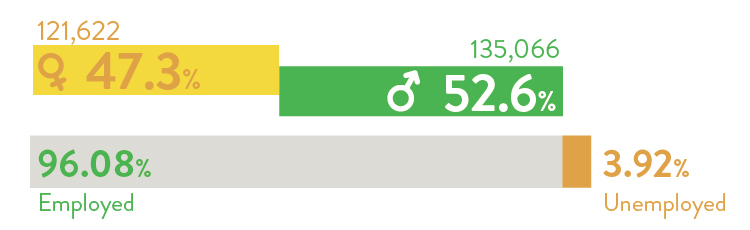
Employed vs. Unemployed
96.08% of the employed population, a total of 267,167 people; the unemployed population accounting for 3.92%.
Average Monthly Income 
Average Working Hours Per Week 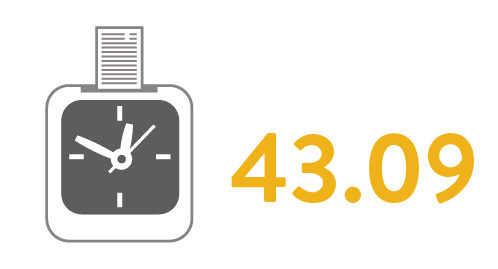
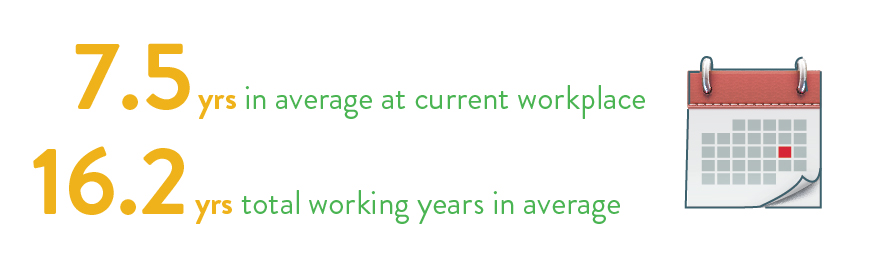
Working Years for the Employed
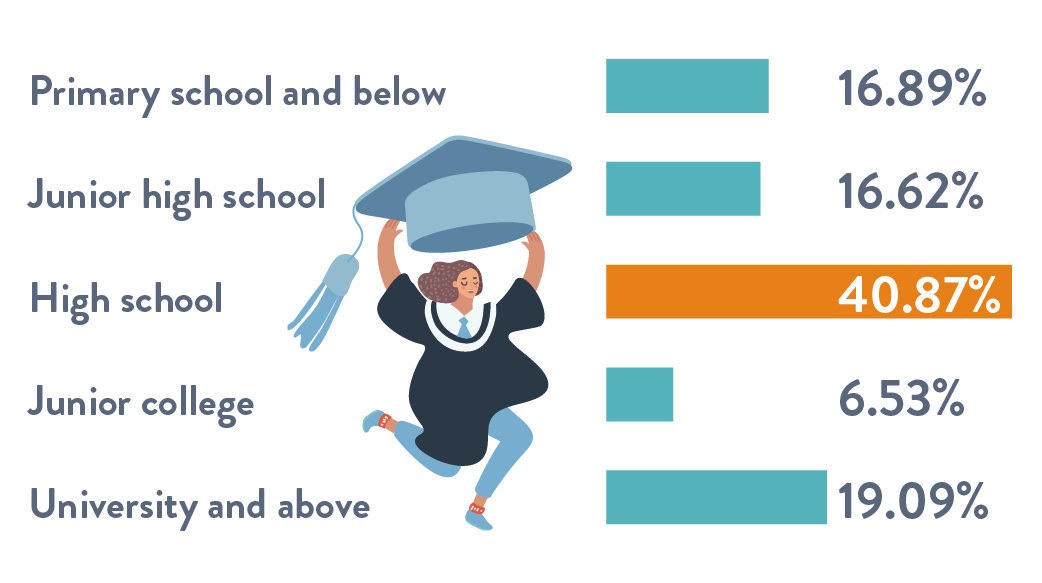
Educational Attainment for Indigenous People
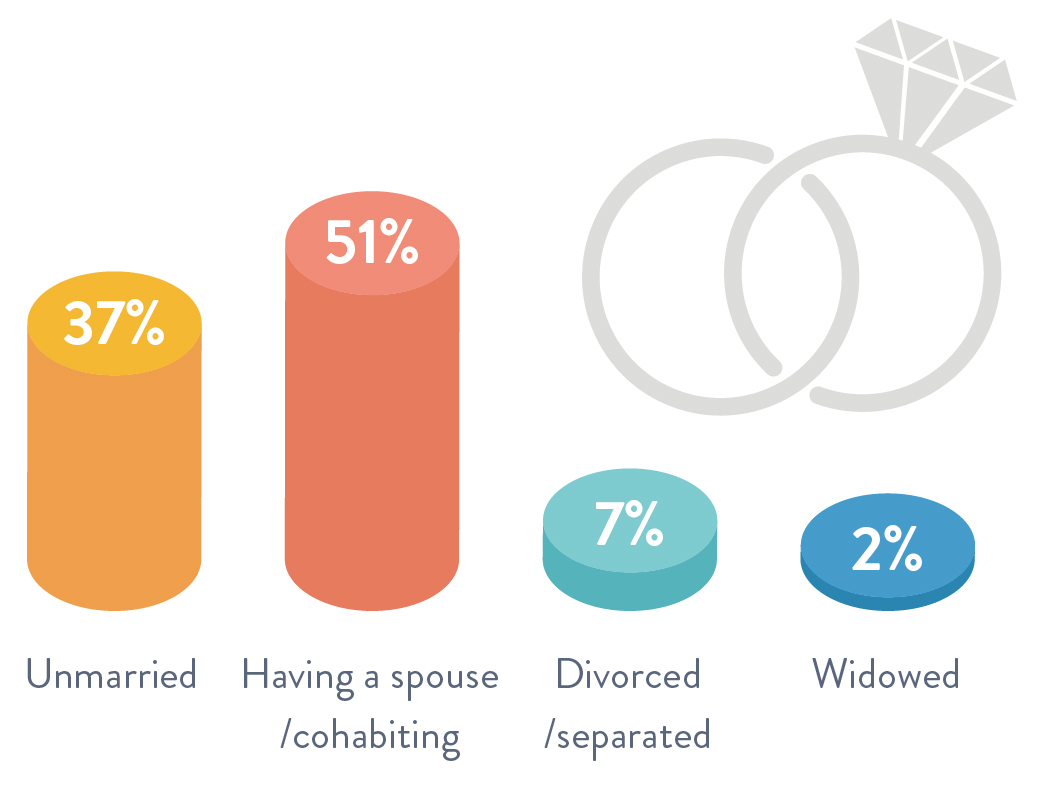
Marital Status of the Employed
Unmarried 37.58%, having a spouse or cohabiting 51.56%, divorced or separated 7.94%, widowed 2.91%.
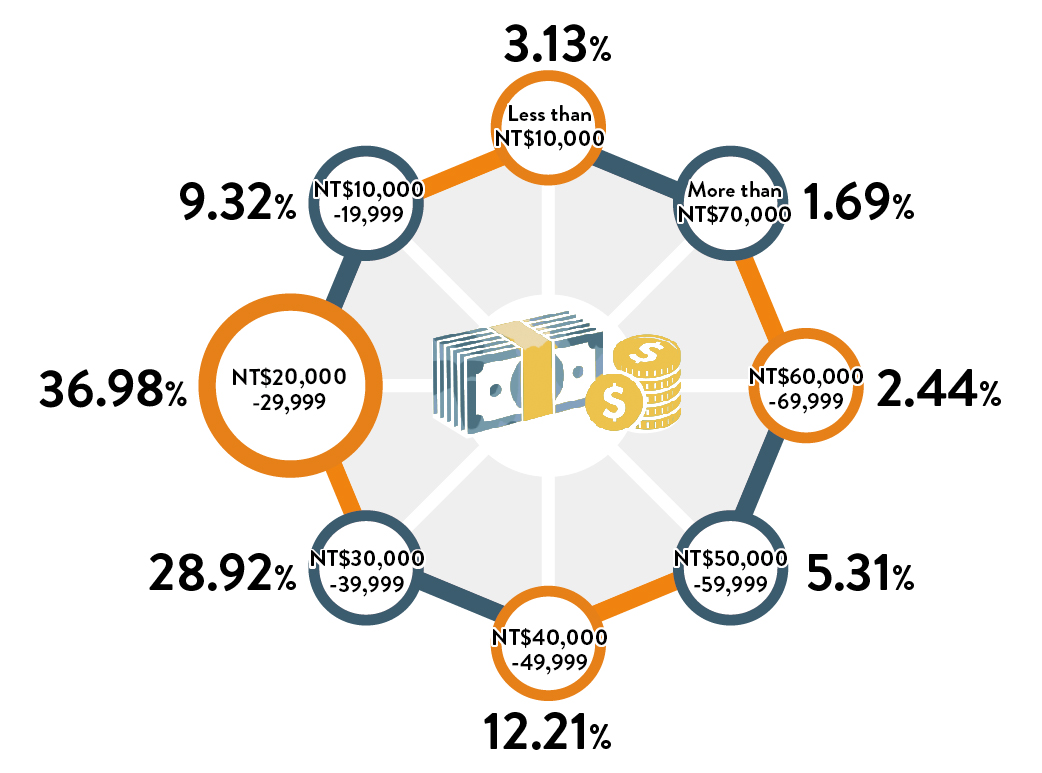
Monthly Primary Job Income of the Employed
Less than NT$10,000: 3.13%, NT$10,000-19,999: 9.32%, NT$20,000-29,999: 36.98%, NT$30,000-39,999: 28.92%, NT$40,000-49,999: 12.21%, NT$50,000-59,999: 5.31%, NT$60,000-69,999: 2.44%, More than NT$70,000: 1.69%.
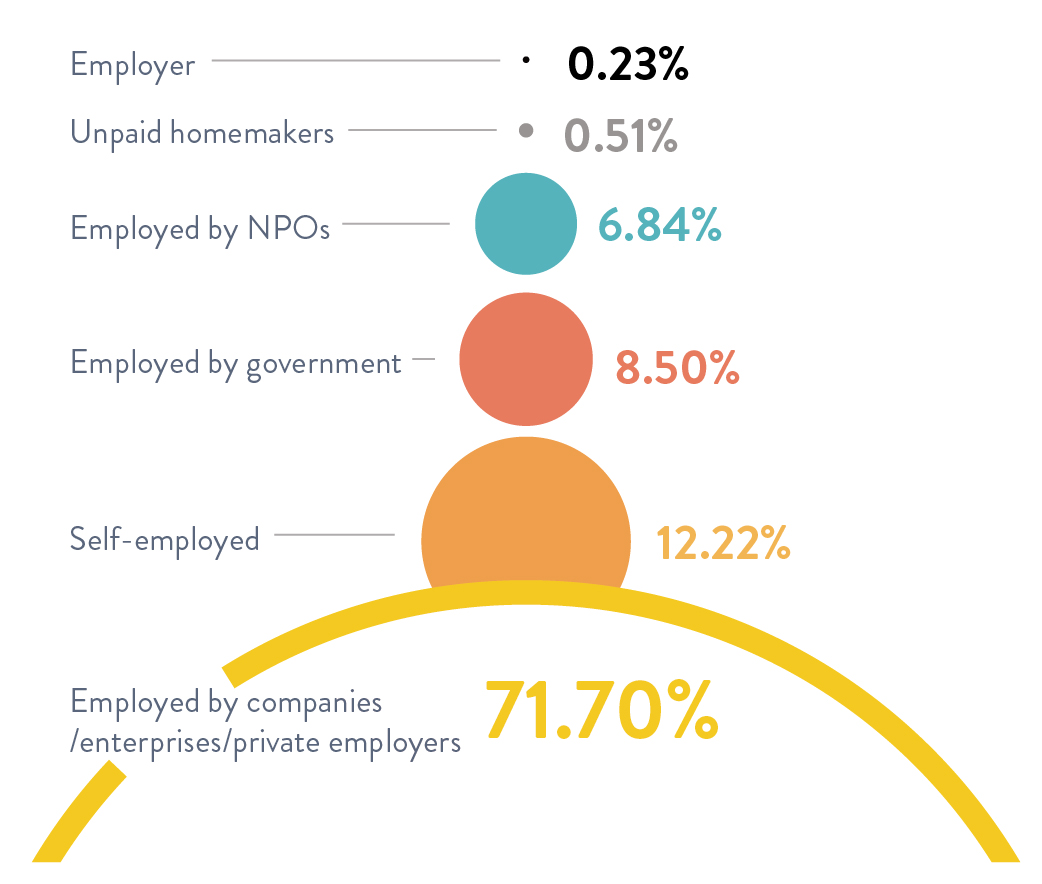
Employment Status of the Employed

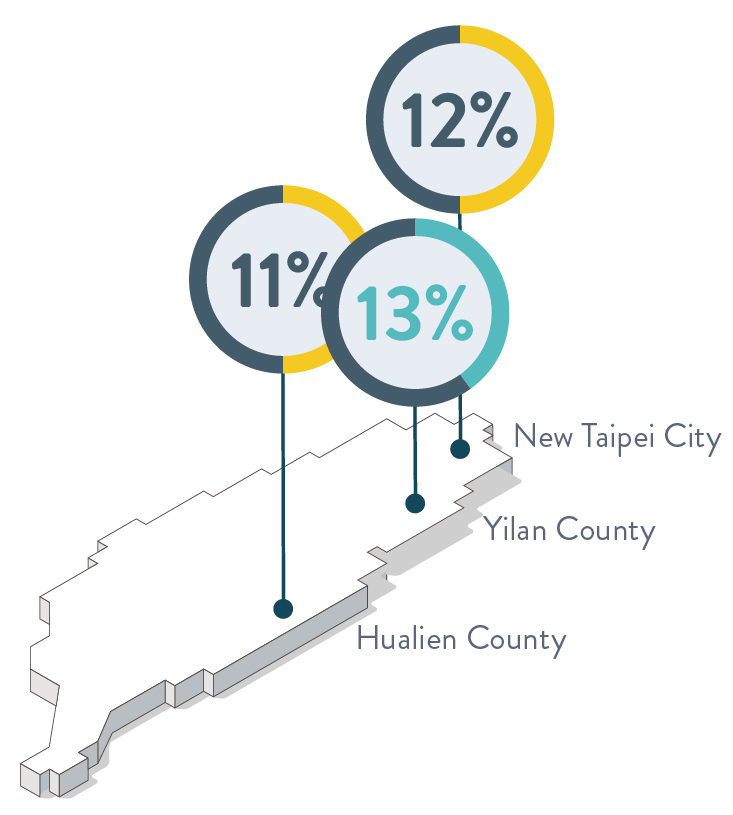
Top 3 Popular Destinations for Work


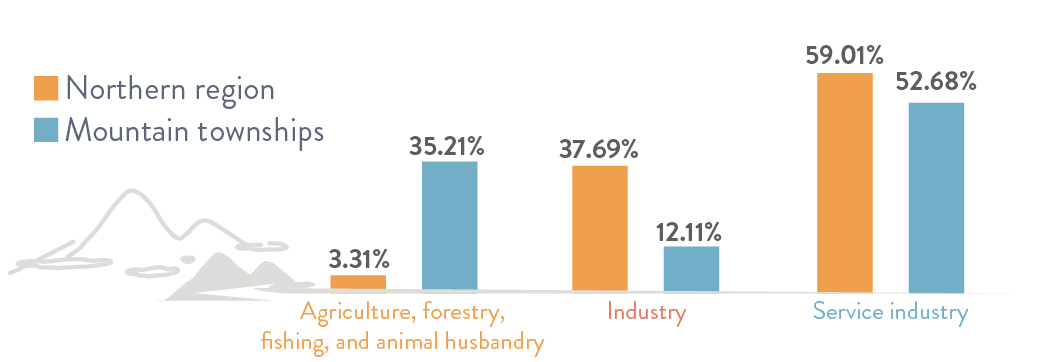
Employment by Industry
| Northern region |
Mountain townships |
|
| Agriculture, forestry, fishing, and animal husbandry |
3.31% | 35.21% |
| Industry | 37.69% | 12.11% |
| Service industry | 59.01% | 52.68% |
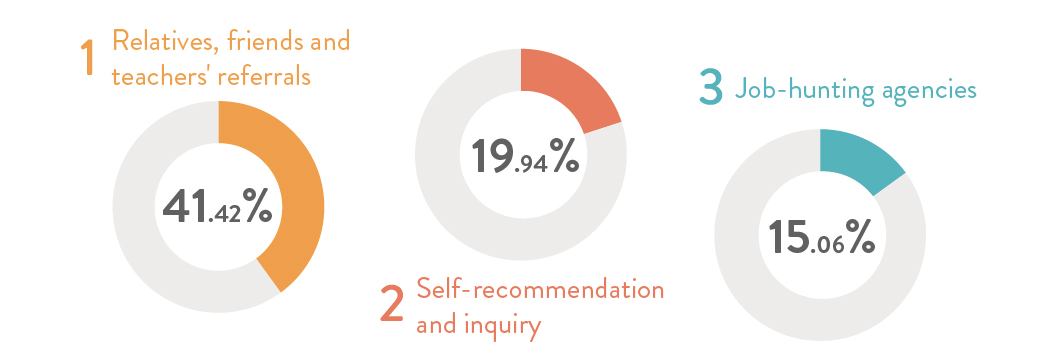
What is the First Job?
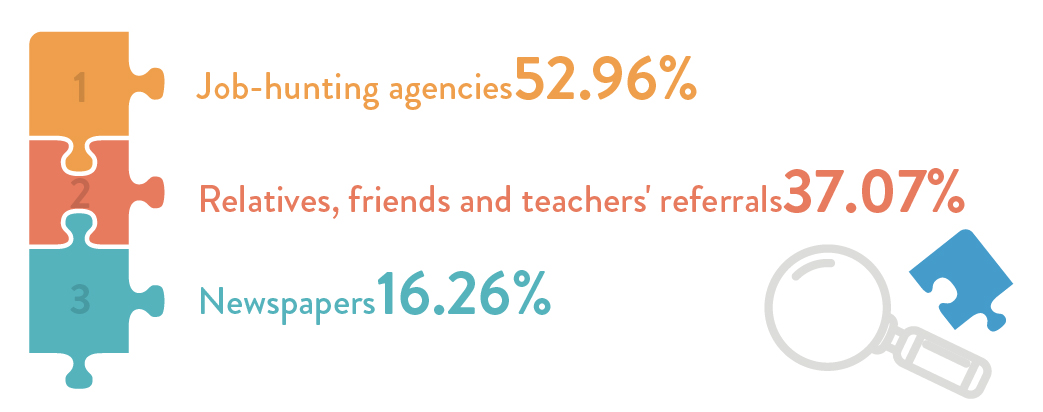
The Employed and the Unemployed Seek Jobs in Totally Different Ways?!
Employed
Unemployed
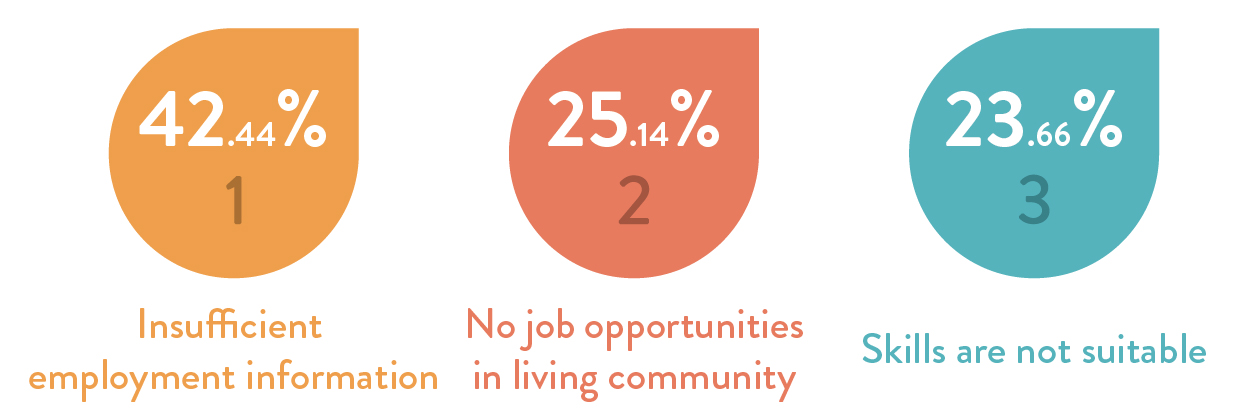
What is Most Challenging for the Unemployed to Find Jobs?
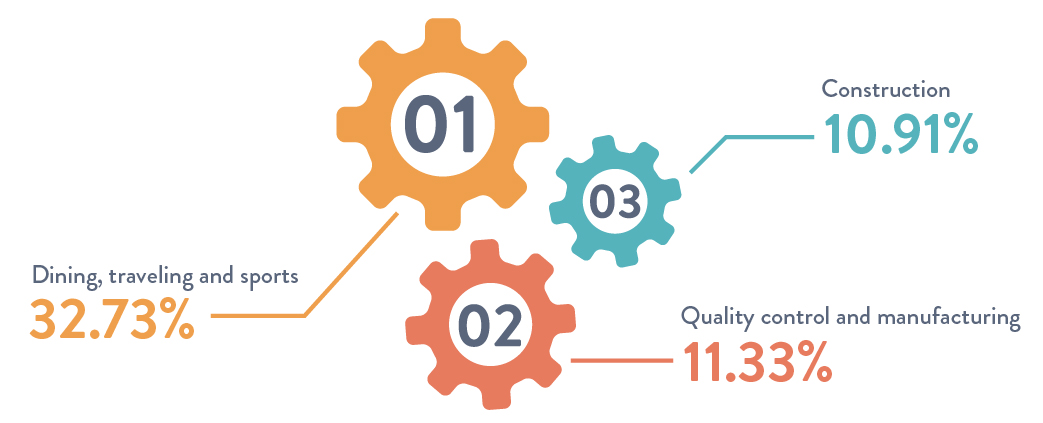
The Most Desirable Jobs for the Unemployed
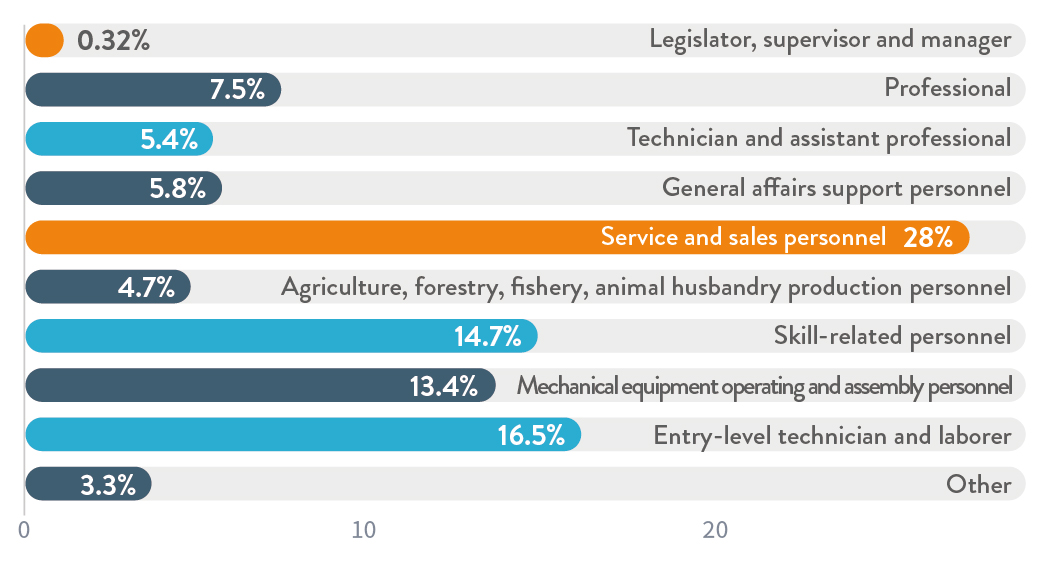
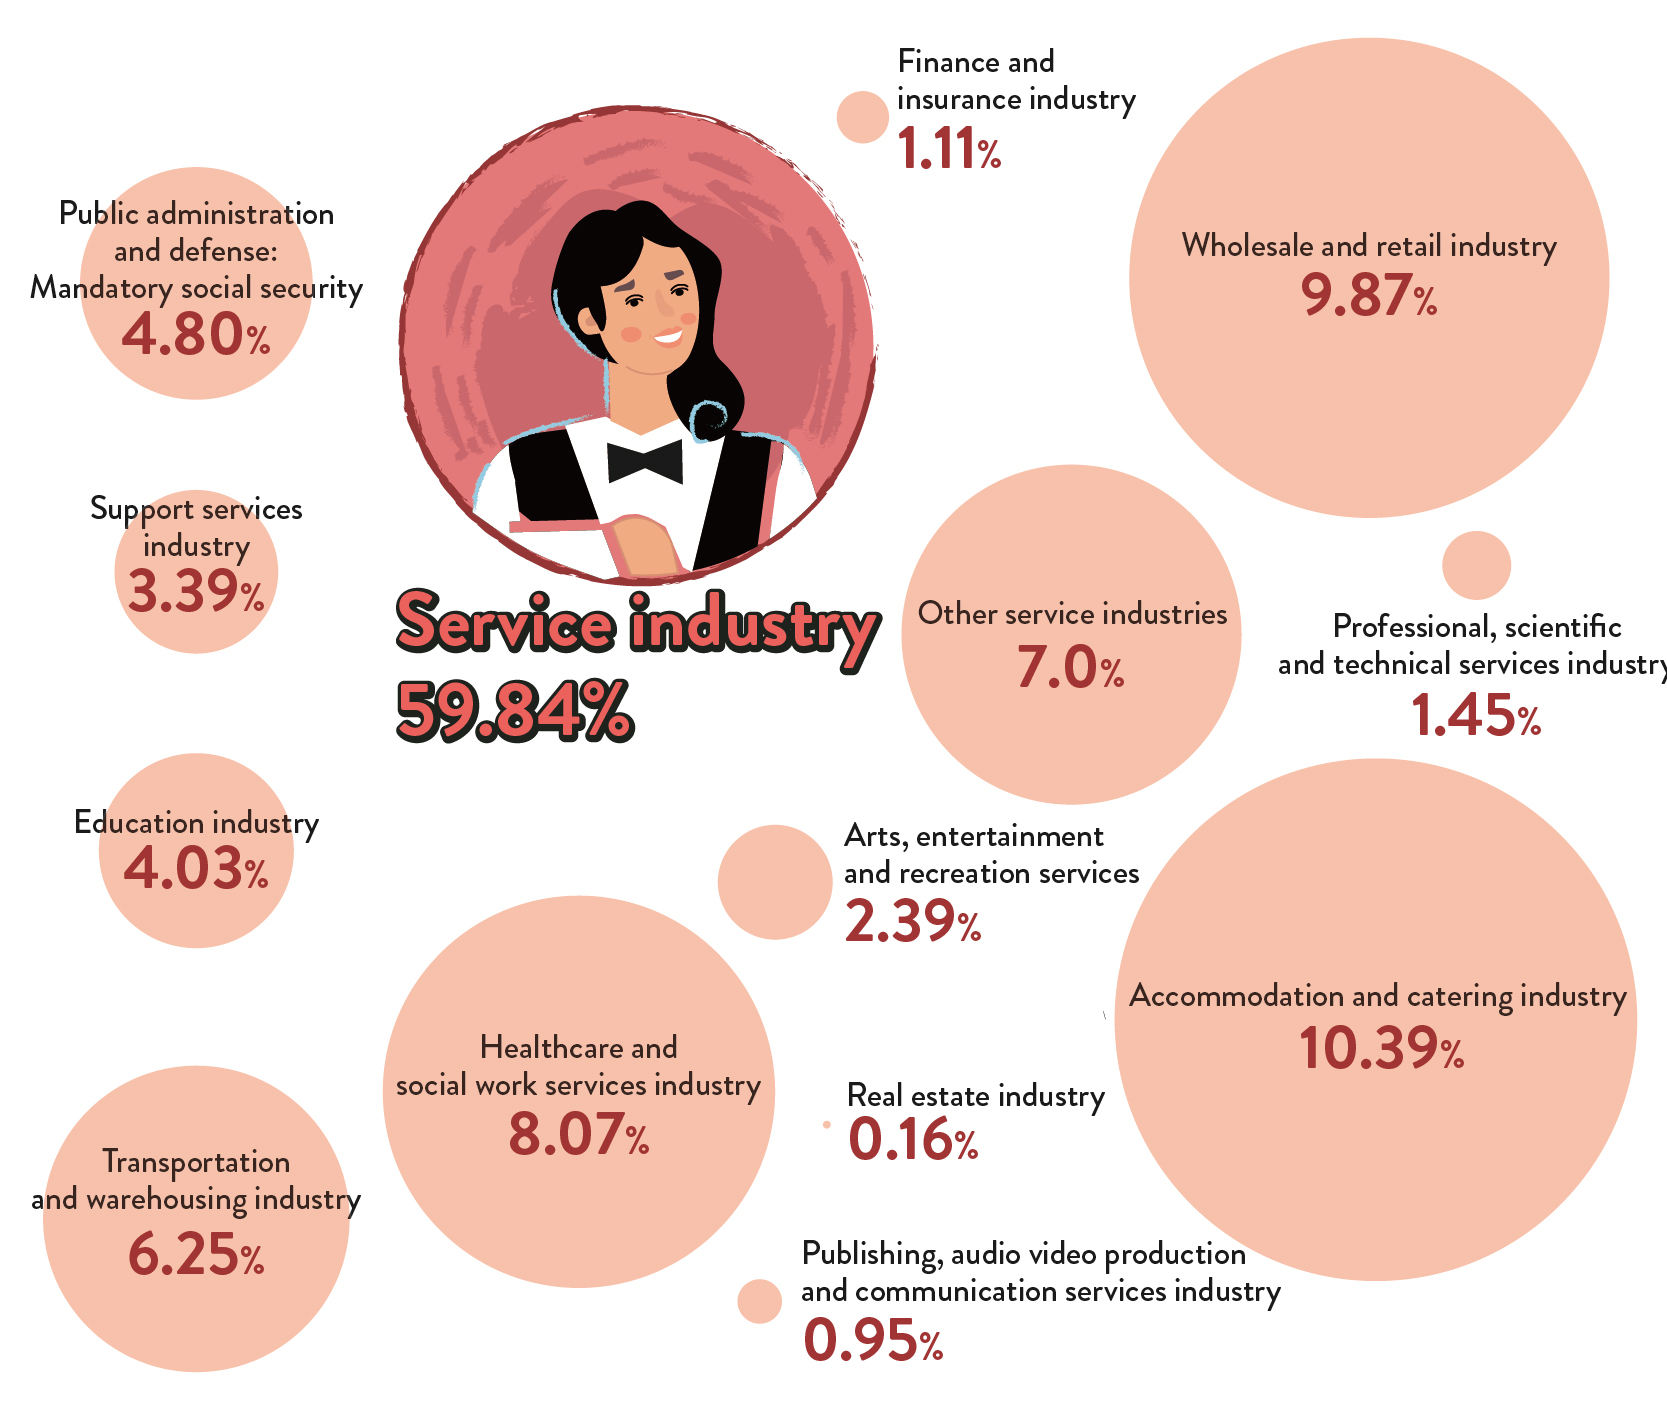
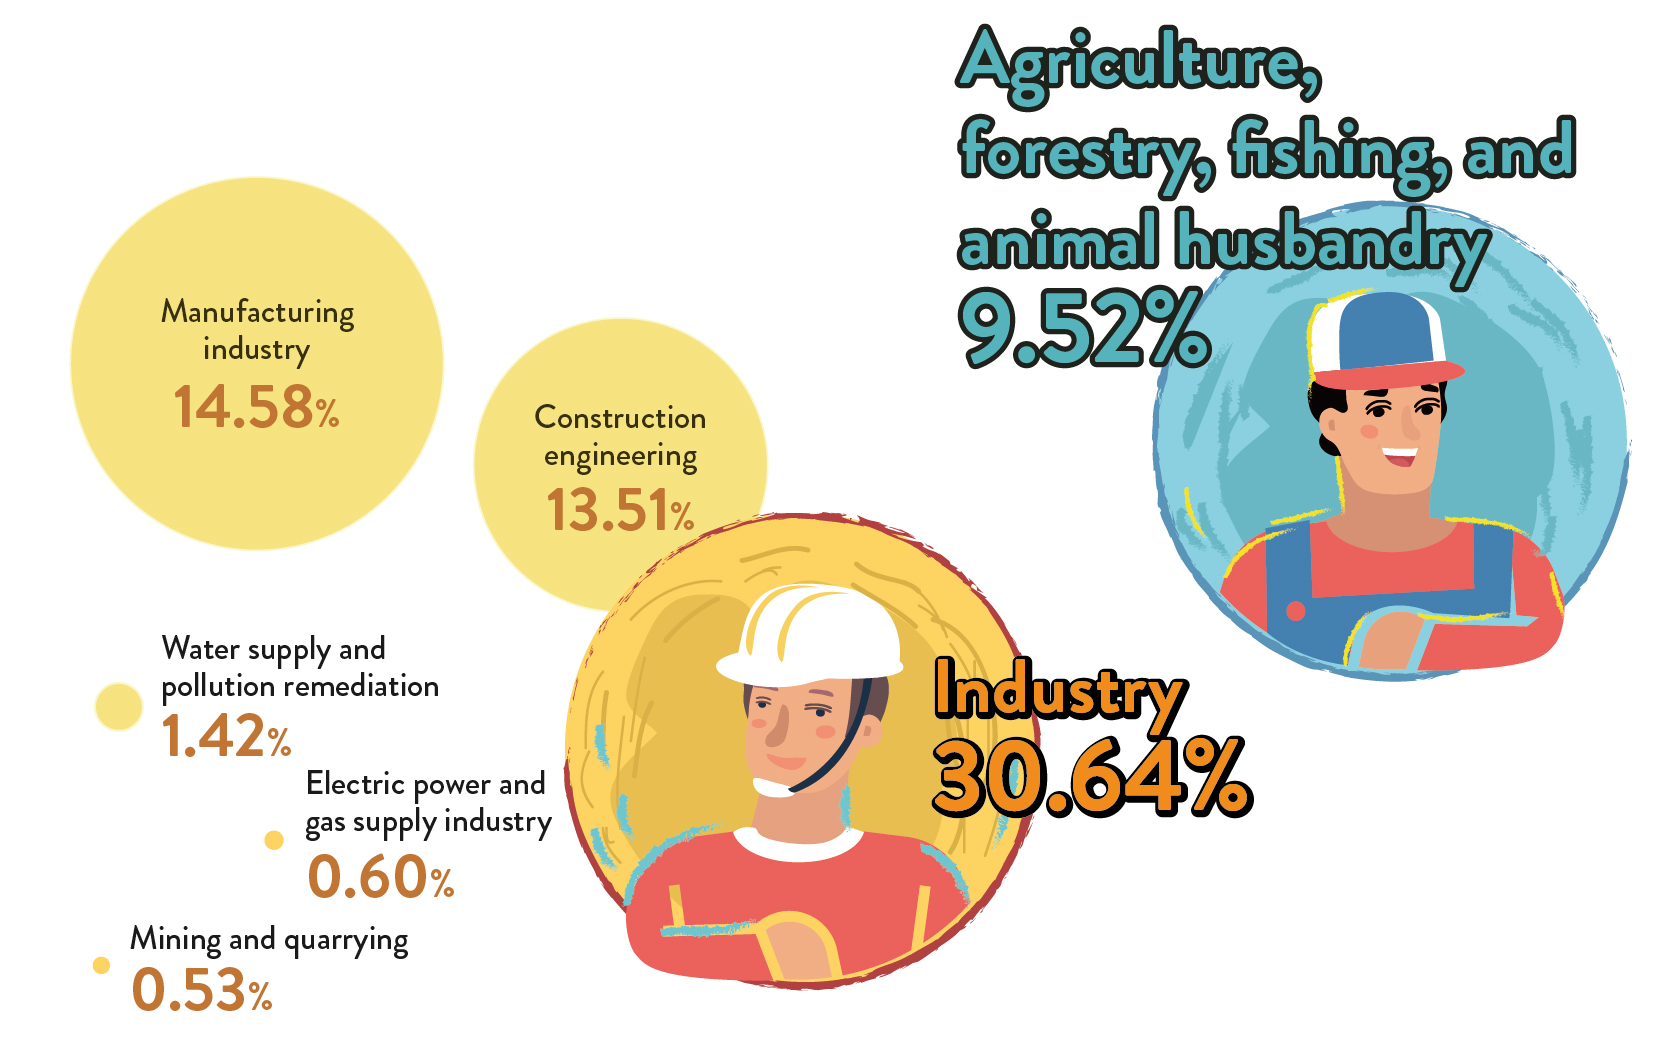
What do Indigenous People Do for Living?
Service industry59.84%:
Accommodation and catering industry 10.39%
Wholesale and retail industry 9.87%
Healthcare and social work services industry 8.07%
Other service industries 7.0%
Transportation and warehousing industry 6.25%
Public administration and defense: Mandatory social security 4.80%
Education industry 4.03%
Support services industry 3.39%
Arts, entertainment and recreation services 2.39%
Professional, scientific and technical services industry 1.45%
Finance and insurance industry 1.11%
Publishing, audio video production and communication services industry 0.95%
Real estate industry 0.16%
Industry30.64%:
Manufacturing industry 14.58%
Construction engineering 13.51%
Water supply and pollution remediation 1.42%
Electric power and gas supply industry 0.60%
Mining and quarrying 0.53%
Agriculture, forestry, fishing, and animal husbandry 9.52%

Source: Council of Indigenous People “108年第1季原住民就業狀況調查報告書”
Related articles